If it wasn’t ascertained by the increase of cars on the road or
the longer lines at the grocery store, here’s the official word:
More people are living in Gilroy than in 2000. No city in Santa
Clara County saw more growth percentagewise than the Garlic
Capital, which had a population increase of 17.7 percent, from
41,464 to 48,821.
If it wasn’t ascertained by the increase of cars on the road or the longer lines at the grocery store, here’s the official word: More people are living in Gilroy than in 2000. No city in Santa Clara County saw more growth percentagewise than the Garlic Capital, which had a population increase of 17.7 percent, from 41,464 to 48,821.
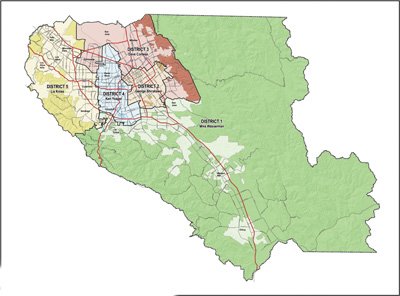
The change is dictating the shift in how supervisorial districts look in Santa Clara County, and it begins with the Citizens Redistrict Committee’s first public meeting of the season Thursday at the Community and Cultural Center in Morgan Hill.
It’s a once-in-a-decade chance for California counties to redraw their supervisorial districts and maintain that one person’s vote carries the same weight as any other person’s vote. Friday was national “Census Day” and marked the announcement of the decennial Census population update.
The county’s 11-person commission, which was appointed by the board earlier this year, met in March to review the law and requirements for redrawing boundaries.
“We want to keep the communities of interest together and minimize the dissolution of votes or overcompacting of ethnic communities. You don’t want to fragment communities so their voices are swallowed up in the bigger majority,” said Susie Wilson, the chair of the commission and former county supervisor. Redrawing must be completed by Nov. 1 of a census year. The commission is looking at a May 19 deadline to recommend a map or a few maps to the county board of supervisors who will cast a vote no later than Sept. 30.
Supervisor Mike Wasserman, who was elected in November, likely won’t see much of a change to the district that encompasses Gilroy, San Martin, Morgan Hill, Los Gatos and neighborhoods in South San Jose and the Evergreen area. The commission must make sure each of the five districts maintain the same number of residents – 356,000 – with a 5 percent cushion available above and below that standard. District 1 is the largest in geographic area and, with the 2010 results, has 354,681 residents. The commission aims to bring it as near to 356,000 as possible. To do that, 1,647 needs to be added, (1,781,642 live in the county, up 5.9 percent since 2000).
Keeping the figure per district as near to 356,000 as possible will help with the 2020 Census, Wilson said, “so there’s room to expand and districts have a better chance of remaining intact.”
The biggest shift won’t be in District 1, but in the northern part of the county after Sunnyvale’s local government sent a letter to the commission requesting the city be contained in one district, instead of split in two.
One idea that was tossed around was shifting the county’s second largest city – San Jose is the largest – and its 140,081 residents into one district with Palo Alto’s District 5 possibly absorbing Los Gatos to make up for the loss. But Wilson said it would never be allowed.
“No way we will move Los Gatos out of District 1. It would totally disenfranchise that supervisor. That’s who they voted in. But ultimately is will go back to the board for approval,” Wilson said. By the commissions’ May 5 meeting, it will begin to sort through various maps and narrow them down before voting May 19 on which to forward to the board of supervisors for their consideration, said Melissa Erickson, the county’s redistricting program manager.
She said the map as it stands now is “still actually within the legal requirements, however, this is the only opportunity for the next 10 years to make any changes,” she said.
Legally, the commission must maximize equal representation, minimize community fragmentation and avoid gerrymandering. Wasserman said the commission will also look at how many cities are within a current district now and try to keep the districts to their current shape and makeup as possible.
According to Santa Clara County, the District 1 breakdown is: 45 percent White, non-Hispanic; 18.2 percent Asian; 2.3 percent Black; 0.3 percent American Indian or Alaska Native; 0.3 percent Islander; 0.2 some other race non-Hispanic; 3.2 percent two or more races; 30.1 percent Hispanic or Latino. District 1 has the third-largest White population and second largest Hispanic population in the county.
In Gilroy, 57.8 percent of residents are Latino or Hispanic; 31.4 are White, non-Hispanic; 6.7 percent are Asian; 2 percent are two or more races, non-Hispanic; 1.5 percent are Black; .04 percent are American Indian ; and 0.1 percent are other, non-Hispanic.
The census itself is conducted, according to Article 1, Section 2 of the Constitution, every 10 years for the purpose of “apportioning the United States House of Representatives.” The first was taken in 1790. California’s Voters First Act mandated the convening of a state Citizen’s Redistricting Commission to redraw the legislative boundaries for the state.
The county has actually been convening such a commission since 1991, Erickson said and was the first county in the state to do so, “in the interest of keeping it transparent.”
Rankings of Total Population, Percent Change, and Numerical Changevar docstoc_docid=”73228851″;var docstoc_title=”Rankings of Total Population, Percent Change, and Numerical Change”;var docstoc_urltitle=”Rankings of Total Population, Percent Change, and Numerical Change”;
Total Population and Change: 2000 and 2010
var docstoc_docid=”73228850″;var docstoc_title=”Total Population and Change: 2000 and 2010″;var docstoc_urltitle=”Total Population and Change: 2000 and 2010″;
Total Population by Race (Hispanic exclusive) and Hispanic or Latino: 2010
var docstoc_docid=”73228848″;var docstoc_title=”Total Population by Race (Hispanic exclusive) and Hispanic or Latino: 2010″;var docstoc_urltitle=”Total Population by Race (Hispanic exclusive) and Hispanic or Latino: 2010″;


